
Automating operations, improving efficiency.
Automating operations, improving efficiency.
Converting Video data to insights.
Global Conference on IOT Insights.
CEO’s interview with industry leaders.
Exploring IOT Products’ intrinsic value.
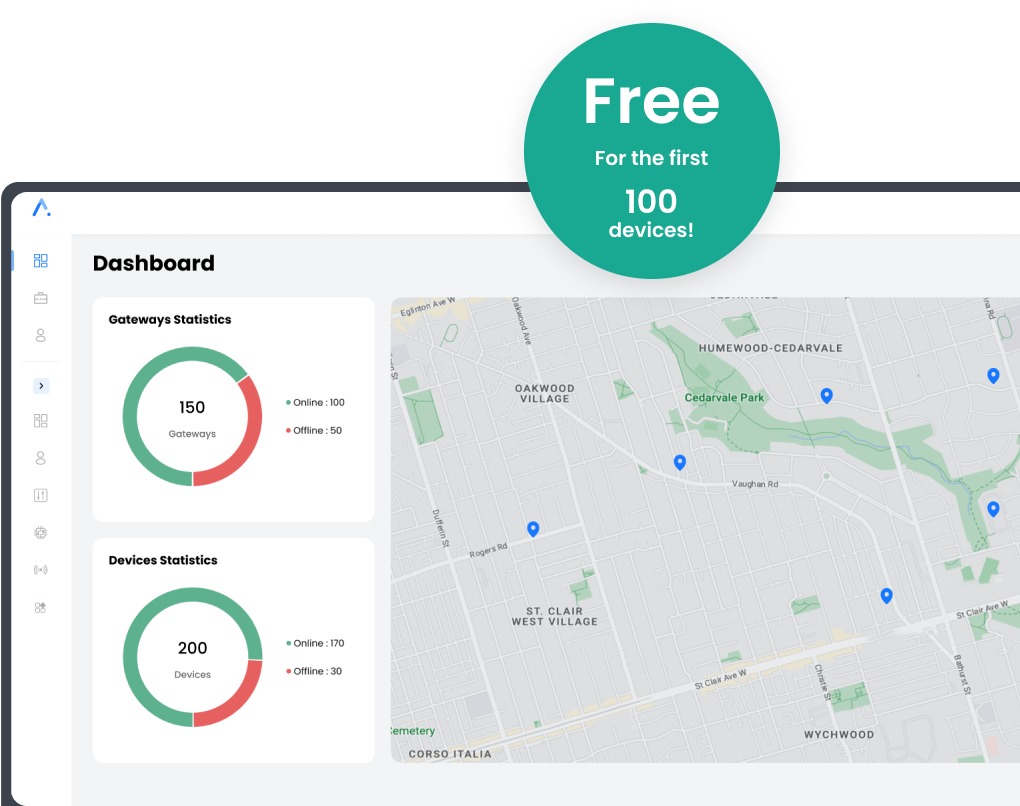
ALEF is our proprietary IoT platform, embodying the principles of accessibility, interoperability, and simplicity.
Designed with the user in mind, ALEF offers an array of features that redefine the IoT experience
ALEF brings a complete range of IoT solutions under a single platform, simplifying your journey from data collection to insightful action.
With a focus on seamless integration, ALEF can work with a variety of communication protocols and hardware, offering unmatched flexibility.
Manage all your connected devices across various applications using ALEF's centralized device management feature. It's never been easier to monitor, update, and control your IoT devices.
The user-friendly dashboard builder allows you to customize your interface with readily available widgets. Analyze and visualize your data the way that works best for you.
Tailor the platform to your brand with our white labelling feature. Make ALEF your own.
Whether you prefer cloud, hybrid, or on-premises, ALEF offers deployment options tailored to your operational needs and preferences.
We’re revolutionizing industries with our robust and innovative Internet of Things (IoT) solutions. We empower businesses to harness the power of real-time data, advanced analytics, and intelligent automation, offering an extensive portfolio of tailored IoT applications and solutions.
Experience how Disrupt-X can transform your operations, elevate your customer experience, and lead to a smarter, safer, and more efficient future. Discover our IoT solutions today!
Ignite Shield is our comprehensive IoT suite designed to monitor critical environmental and infrastructural parameters.
Ignite Meter revolutionizes utility management with real-time and accurate water, gas, and power metering solutions.
Control and secure your premises with smart padlocks and parking locks.
Track personal belongings, animals, and other assets with precision and ease. Additionally, monitor mobile cold storage.
Streamline parking access and commercial parking management with smart and innovative solutions.
Revolutionize waste management and rodent monitoring with Cloud Orbit's smart, efficient, and easy-to-use solutions.
Keep a close eye on your fleet with our light and heavy vehicles tracking solutions and heavy machinery tracking.
Maximize the potential of your urban spaces with our Urban AI suite, Smart parking, Smart Space Management and Smart Facility Analytics.
Leverage intelligent security and safety with intrusion alarm services, smart panic buttons, and fire monitoring solutions.
A cutting-edge solution for efficient parking management using real-time license plate recognition.
We are expanding our horizon by incorporating people counting, demographic analysis, movement tracking and more into our video analytics portfolio for a multitude of applications.


A global conference unifying industry experts for knowledge-sharing and exploring IoT’s transformative potential.
Initiating dialogues on trends, IoT's impact, and global business implications.
These panels dive deep into specific topics, allowing for detailed and thought-provoking discussions.
The conference aims to equip its attendees with the knowledge and insights necessary to stay ahead in the ever-evolving IoT landscape.
Opportunity to network with industry leaders, experts, and like-minded professionals from around the world leading to collaborations, partnerships, or simply the exchange of valuable ideas.


Get the latest news and our insights on Partnerships, IoT Solutions, Development and much more…
Are you ready to take a leap into the future?
Our platform offers cutting-edge solutions that can revolutionize your operations. But don’t just take our word for it, experience it yourself!
Fill out the form below and our team will reach out to you for a personalized demo.
Please enter your email address below.
And subscribe to our insightful newsletter, so you’ll keep updated with the latest advancements at Disrupt-X.